Gibbs phenomenon#
The synthesis equation of Fourier Theorem reconstructs a continuous time periodic signal using an infinite sum:
When we “truncate” this sum, we basically do an approximate reconstruction:
As we increase \(N\), the function gets better approximated by the series sum. The energy of the error between the original function and its truncated reconstruction can be defined as
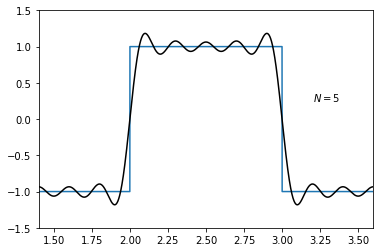
We expect that as we increase \(N\), the energy of the error gets smaller. However, there is a peculiar behavior of the Fourier series while approximating the functions, which have discontinuities. As we increase \(N\), the width of the ripples around the discontinuities decreases and converges to a constant value of oscillation around the discontinuities. This behavior is known as the \textbf{Gibbs phenomenon}.
Let us observe this phenomenon on a rectangular function below.
import numpy as np
from matplotlib import pyplot as plt
x = np.linspace(0,4,5000)

square_wave = 1 - 2 * (x.astype(int) % 2)

N = 5
fsq = np.zeros_like(x)
for i in range(N):
    n = 2*i + 1
    fsq += np.sin(n * np.pi *x) / n
fsq *= 4 / np.pi

fig, ax = plt.subplots()
ax.plot(x, square_wave)
ax.plot(x, fsq, 'k')
ax.set_ylim(-1.5,1.5)
ax.set_xlim(1.4, 3.6)
ax.text(3.2, .25, (r'$N=%d$' % N));

The plot above is for \(N=5\). As we increase \(N\), the approximation gets better. However, no matter how high \(N\) is, there will be a discrepancy between the original signal (blue) and its approximation (blue) around the discontinuties. Observe this phenomenon yourself by changing the value of \(N\) above and re-running the code.
Related content:
Explore Fourier series representation for continuous time periodic signals.
An example on the duality of convolution and multiplication.

