Fourier series representation for continuous time periodic signals#
A continuous time periodic function \(x(t)\) with fundamental period \(T\) satisfying the Dirichlet conditions, can be represented as the superposition of harmonically related complex exponentials:
The coefficients \(a_k\) are called the Fourier Series coefficients or spectral coefficients and can be uniquely obtained from the following integral:
The limits of the integral cover one full period \(T\) of the periodic function \(x(t).\)
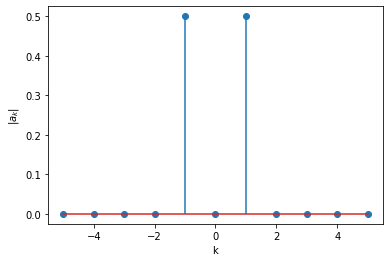
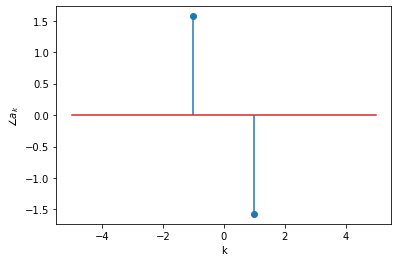
Using SymPy, we can easily evaluate the integral in the analysis example. Let us compute the spectral coefficients of \(x(t) = \sin(t)\) and plot its magnitude and phase spectrums.
import sympy as sym
from sympy import I # the imaginary number "j" is represented as "I" in SymPy

t = sym.symbols('t', real=True)
x = sym.sin(t)

T = 2*sym.pi # period of the signal
omega0 = 1 # base angular frequency of the analysis

# let's compute a0
k=0
a0 = (1/T)*sym.integrate(x*sym.exp(-I*omega0*k*t), (t, 0, T))
print(a0)
0
And \(a_1\) and \(a_{-1}\):
k=1
a1 = (1/T)*sym.integrate(x*sym.exp(-I*omega0*k*t), (t, 0, T))
print(a1)

k=-1
a_m1 = (1/T)*sym.integrate(x*sym.exp(-I*omega0*k*t), (t, 0, T))
print(a_m1)
-I/2
I/2
I in SymPy represents the imaginary number \(j\).
Let us compute the other coefficients and plot magnitude and phase spectrums.
# let's write a function to compute the kth spectral coefficient
def compute_ak(x, T, omega0, k):
    ak = (1/T)*sym.integrate(x*sym.exp(-I*omega0*k*t), (t, 0, T))
    return ak

mag = []
phase = []
ks = range(-5,6,1)
for k in ks:
    ak = compute_ak(x, 2*sym.pi, 1, k)
    mag.append(sym.Abs(ak))
    phase.append(sym.arg(ak))

from matplotlib import pyplot as plt

# magnitude spectrum
plt.figure()
plt.stem(ks, mag)
plt.xlabel('k')
plt.ylabel(r'$|a_k|$')

# phase spectrum
plt.figure()
plt.stem(ks, phase)
plt.xlabel('k')
plt.ylabel(r'$\angle a_k$');
/usr/local/lib/python3.9/site-packages/numpy/ma/core.py:3371: RuntimeWarning: invalid value encountered in cast
  _data[indx] = dval
/usr/local/lib/python3.9/site-packages/matplotlib/cbook/__init__.py:1335: RuntimeWarning: invalid value encountered in cast
  return np.asarray(x, float)
Let us do another example, for \(x(t) = 1 + \sin(t) + \cos(t)\).
x = 1 + sym.sin(t) + sym.cos(t)

for k in ks:
    ak = compute_ak(x, 2*sym.pi, 1, k)
    print("a_", k, " = ", ak)
a_ -5  =  0
a_ -4  =  0
a_ -3  =  0
a_ -2  =  0
a_ -1  =  1/2 + I/2
a_ 0  =  1
a_ 1  =  -I*(1 + I)/2
a_ 2  =  0
a_ 3  =  0
a_ 4  =  0
a_ 5  =  0
Related content:
An example on the duality of convolution and multiplication.