Decompose a signal into its even and odd components#
In Section 1.5.2 of our book, we had a look at even and odd signals.
Any signal \(x(t)\) can be decomposed into an even and an odd signal as follows.
\(x(t) = \frac{1}{2}x(t) + \frac{1}{2}x(-t) + \frac{1}{2}x(t) - \frac{1}{2}x(-t)\).
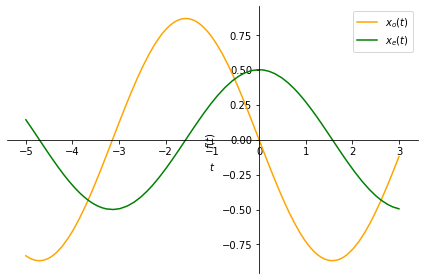
Let us call the first two-terms on the right hand side as \(x_e(t)\):
\(x_e(t) = \frac{1}{2}x(t) + \frac{1}{2}x(-t)\).
\(x_e(t)\) is an even function.The proof is left to the reader.
Let us call the remaining two terms as \(x_o(t)\), which is an odd function:
\(x_o(t) = \frac{1}{2}x(t) -\frac{1}{2}x(-t)\).
With these definitions, decomposing a given signal into its even and odd parts becomes straightforward as shown below.
import sympy as sym
sym.init_printing()

t = sym.symbols('t', real=True)

def decompose(x):
    # apply time-reverse to x(t):
    xrev = x.subs(t, -t)

    xe = 0.5*x + 0.5*xrev
    xo = 0.5*x - 0.5*xrev

    return xe, xo
Let us now apply this decomposition to the following signal:
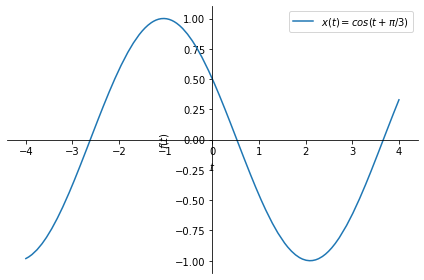
\(x(t) = \cos(t+\frac{\pi}{3})\).
# the signal
x = sym.cos(t+sym.pi/3)

# decompose it
xe, xo = decompose(x)

# plot the original signal
px = sym.plot(x, (t, -4, 4), legend=True, label='$x(t)=cos(t+\pi/3)$',
              show=False);
px.show()

# on a separate plot, show even and odd components
px = sym.plot(xe, (t, -5, 3), legend=True, label='$x_e(t)$',
              show=False, line_color='green');
py = sym.plot(xo, (t, -5, 3), legend=True, label=r'$x_o(t)$', show=False,
              line_color='orange')
py.extend(px)
py.show()


Exercise: Write a function to decompose a given discrete time signal into its even and odd components.
Related content:

